
Specific surface and soil behavior
The specific surface of soil particles is a fundamental parameter that allows us to know the predominance of gravitational or electrical-chemical forces on them, which directly influences the macro behavior of the soil. But what is the specific surface? How can it be determined? If you want to learn more about this topic, read on...
Content
Definition of specific surface of a soil particle
The forces on which the behavior of coarse-grained soils depends are different from those governing the behavior of fine-grained soils. Coarse-grained soils are significantly affected by their own weight (which implies the action of gravity), whereas the importance of electrical and capillary forces become more important as the particle size decreases, and hence their specific surface Se increases.
The specific surface Se of a soil particle is defined as the ratio of its area A to its mass M. The relevance of Se in soil behavior can be inferred by analyzing the following expression, which relates the electrical forces to the gravitational force (Santamarina et al, 2002):

In the above expression: Felec = electric forces; W = soil particle weight; A = soil particle area; Rdd = repulsive forces; Att = attractive forces; M = particle mass; g = acceleration of gravity. It is evident that, as Se increases, Felec increases as the two terms are directly proportional, which implies a greater influence of these forces on the behavior of the soil.
On the other hand, Table 1 summarizes the main characteristics of some typical clay minerals, as well as silts and sands of different grain sizes.
Table 1 Properties of clay minerals, silts and sands (Source: compilated from Santamarina et al 2022, and Baver, 1956).
Property | Clay | Silt | Sand | |||
Montmorillonite | Illite | Kaolinite | D = 0,002 mm | D = 0,01 mm | D = 0,1 mm | |
Se (m2/g) | 400 – 800 | 80 – 100 | 10 – 20 | 0,15 | 0,03 | 0,003 |
LL | 100 – 950 | 60 – 120 | 30 – 110 | — | — | — |
LP | 50 – 100 | 35 – 60 | 25 – 40 | — | — | — |
Actividad | 0,9 – 7,0 | 0,5 – 1.0 | 0,3 – 0,5 | — | — | — |
Se = specific surface; LL = liquid limit; PL = plastic limit; D = diameter of soil particle.
The information shown in the table above is very interesting, as it allows us to deduce that the Se values for clays are considerably higher, by several orders of magnitude, than those corresponding to silts and sands. It is also evident that LL and Activity values are directly proportional to Se, which implies that clays with higher Se will have a more pronounced reaction to the presence of water. This is why, for instance, the swelling potential of a montmorillonite clay (with high Se) is higher than that of a kaolinite (with a relative low Se value).
Determination of the specific surface for soils
The determination of Se can be very useful for estimating the properties of a soil sample, and for predicting its engineering behavior.
A relatively simple procedure for estimating Se is that proposed by Santamarina et al (2002), which is based on information obtained from a typical sieve and hydrometer grain size test:

As follows from the above expression, based on the uniformity coefficient Cu, the density of water ρω, the specific gravity of solid particles Gs, and the mean sample diameter D50, it is possible to estimate the value of Se for a soil sample.
On the other hand, Farrar & Coleman (1967) developed an expression to estimate Se (in m2/g) as a function of LL, based on analyses carried out on British clays with LL values varying between 28 and 121:
Se= 1,8LL – 34
Although approximate, these equations give an idea of the order of magnitude of Se for a soil sample. In routine soil studies, it would be possible to develop a profile of the variation of Se with depth, based on information from grain size and consistency limit tests, which would be a very useful tool for estimating the expected behavior of the soil.
Importance and applications of specific surface in practical Geotechnical Engineering
According to Santamarina et al (2002), the physical processes governing soil behavior change when Se exceeds approximately 1 m2/g, because soils with higher Se undergo sedimentation and formation processes controlled by environmental factors, and exhibit a marked increase in stiffness under unsaturated conditions, accompanied by a marked volumetric shrinkage.
Even small amounts of fines can have a considerable effect on the behavior of coarse soils. Fines fill pore spaces between larger particles, control soil permeability, determine whether a given loading condition is drained or undrained, and increase the threshold for elastic deformation and degradation of soils. In addition, a relatively small percentage of fines can form stabilizing bridges between coarser particle contacts, which provide significant strength and stiffness to the soil (e.g. loess). The Unified Soil Classification System recognizes these observations, clearly separates fines from coarse soils, captures the importance of fines in coarse soils, and even addresses whether these fines are of high or low plasticity, i.e. high or low specific surface area (Santamirna et al, 2002).
Based on the above, it is evident that the behaviour of the soil will depend on the amount of clay particles, i.e. the colloidal fraction FF (particles smaller than 2 μm) contained in the soil. Thus, in addition to the profile of Se variation with depth, it is possible to use the criterion originally proposed by Mitchell (1976), and later complemented by Lupini et al (1981) and Boiero (2021), according to which, from a practical point of view (i.e. to be applied in routine geotechnical projects), when FF > 20% the soil will have a "clay-like" behaviour, due to the presence of enough particles with high Se to make electrochemical forces prevail in the macro behaviour of the soil mass; and for FF < 20% the soil will have a "sand-like" behaviour, entirely governed by the granular phase. Figure 1 illustrates this qualitatively.
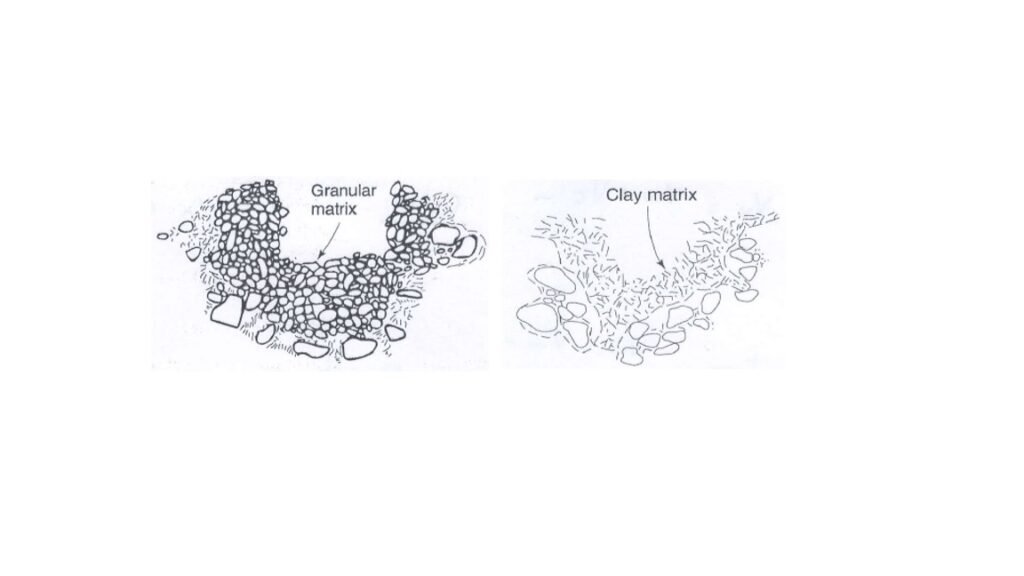
Figure 1 Soil structure for soils with FF 20% (right), in which electro-chemical forces predominate, due the higher Se value (Source: modified from Holtz et al, 2011).
This concludes this post. As a final comment, I think it is worth mentioning that, since the behavior of a soil mass is linked to the amount of colloidal particles it contains, and considering that LL is a relatively simple way of estimating the influence of these particles, it is essential that the determination of the Atterberg limits be carried out accurately in the laboratory.
References
- Baver, L.D. (1956) “Soil physics”. John Wiley and Sons, New York.
- Boiero, A. (2021) “Development of a rational methodology for soil geotechnical characterization”. 6th International Conference on Geotechnical and Geophysical Site Characterization. Available at http://isc6.org/images/Cikkek/Sessions/ISC2020-12.pdf. Budapest, Hungary.
- Farrar, D.M., and Coleman, J.D. (1967) “The correlation of surface area with other properties of nineteen British clays”. Journal of Soil Science, 18(1): 118–124. London, UK.
- Holtz, R.; Kovacs, W. & Sheahan, T. (2011) “An introduction to Geotechnical Engineering”. Second Edition. Prentice Hall. New Jersey, USA.
- Lupini, J., Skinner, A. & Vaughan, P. (1981) “The drained residual strength of cohesive soils”. Geotechnique, 31, pp. 181-212. London, UK.
- Mitchell, J. (1976) “Fundamentals of soil behavior”, 1st John Wiley & Sons, New Jersey, USA.
- Santamarina, J., Klein, K., Wang, Y. & Prencke, E. (2002) “Specific surface: determination and relevance”. Canadian Geotechnical Journal, 39, pp. 233-241. Canada.